

Pain Points Solved
What kills a utility tender before it starts
| Pain point | Why it happens | How ems-solar solves it |
|---|---|---|
| LCOE keeps falling on you | LCOE fell toward USD 39/MWh in 2025 and is forecast −30% by 2035 | 620–720 W modules cut module count ~25% versus the 550 W class — fewer racks, fewer wiring runs |
| Land is the bottleneck | A 1 MW plant needs 1.2–2 ha; tracker rows multiply that cost | Higher-power modules cut land and tracker count per MW, lowering BOS per watt |
| Bankability gates | Top-10 makers hold ~75% share; developers demand proof from challengers | PVEL-style testing, TÜV and UL 61730 listings, IEC 62941 quality system, 30-yr power warranty |
| Supply certainty | 536 GW shipped globally in 2025; EPCs lose tenders on delivery risk | Firm capacity allocation and a logistics SOP with bracing, ISPM-15 pallets and loading reports |
Utility Lineup
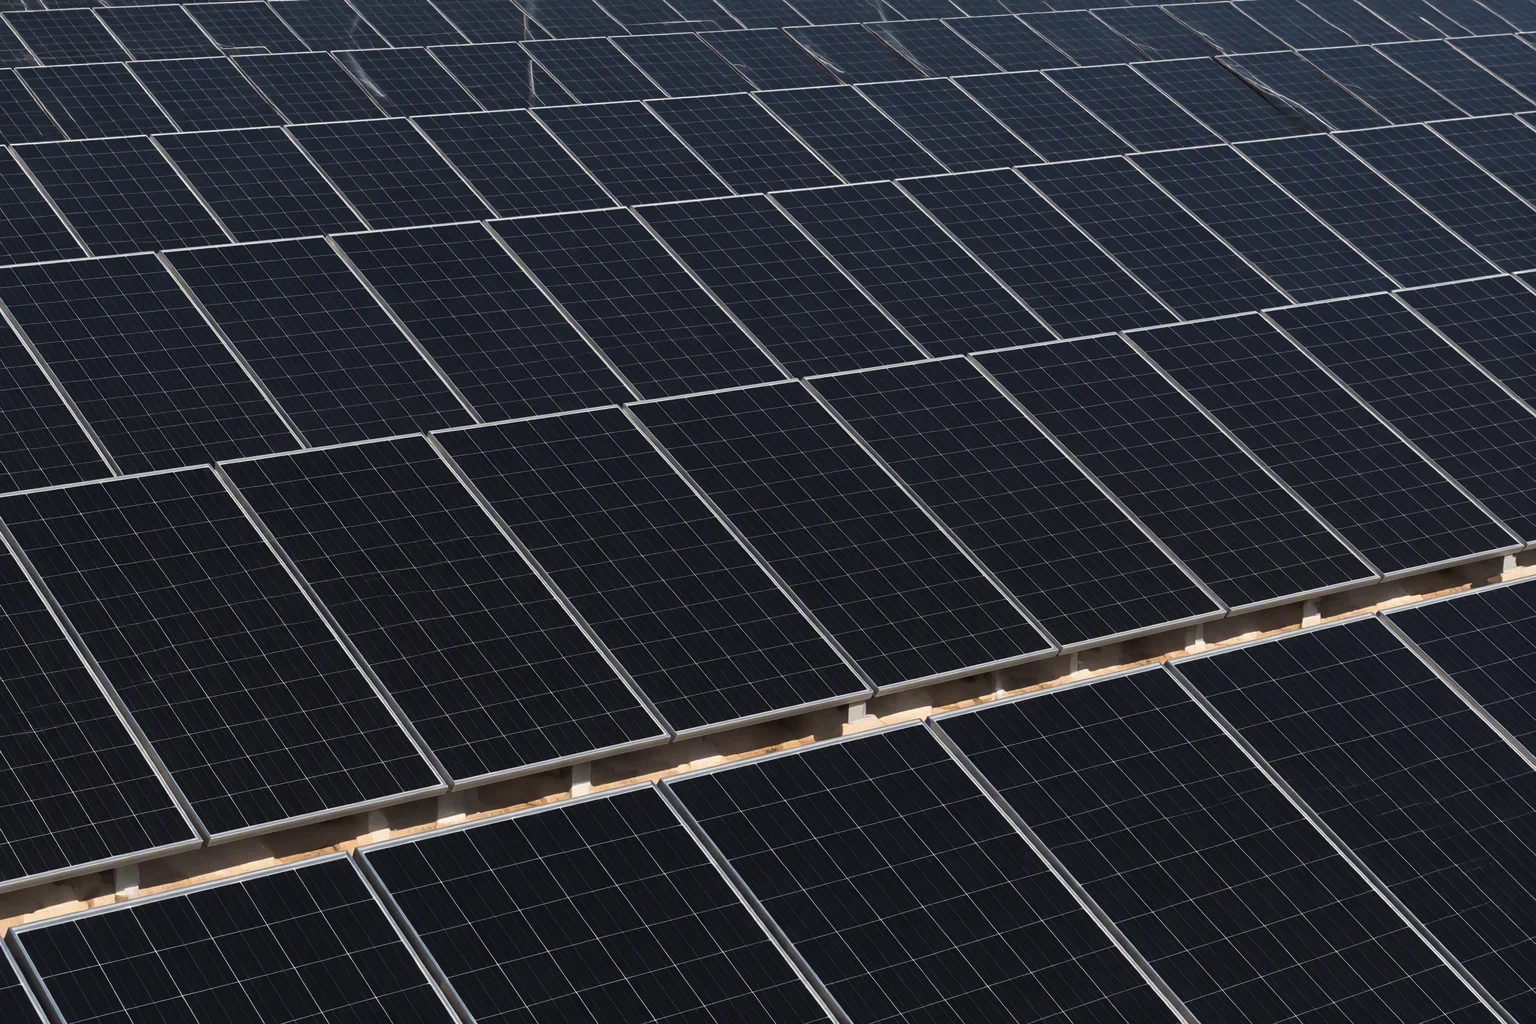
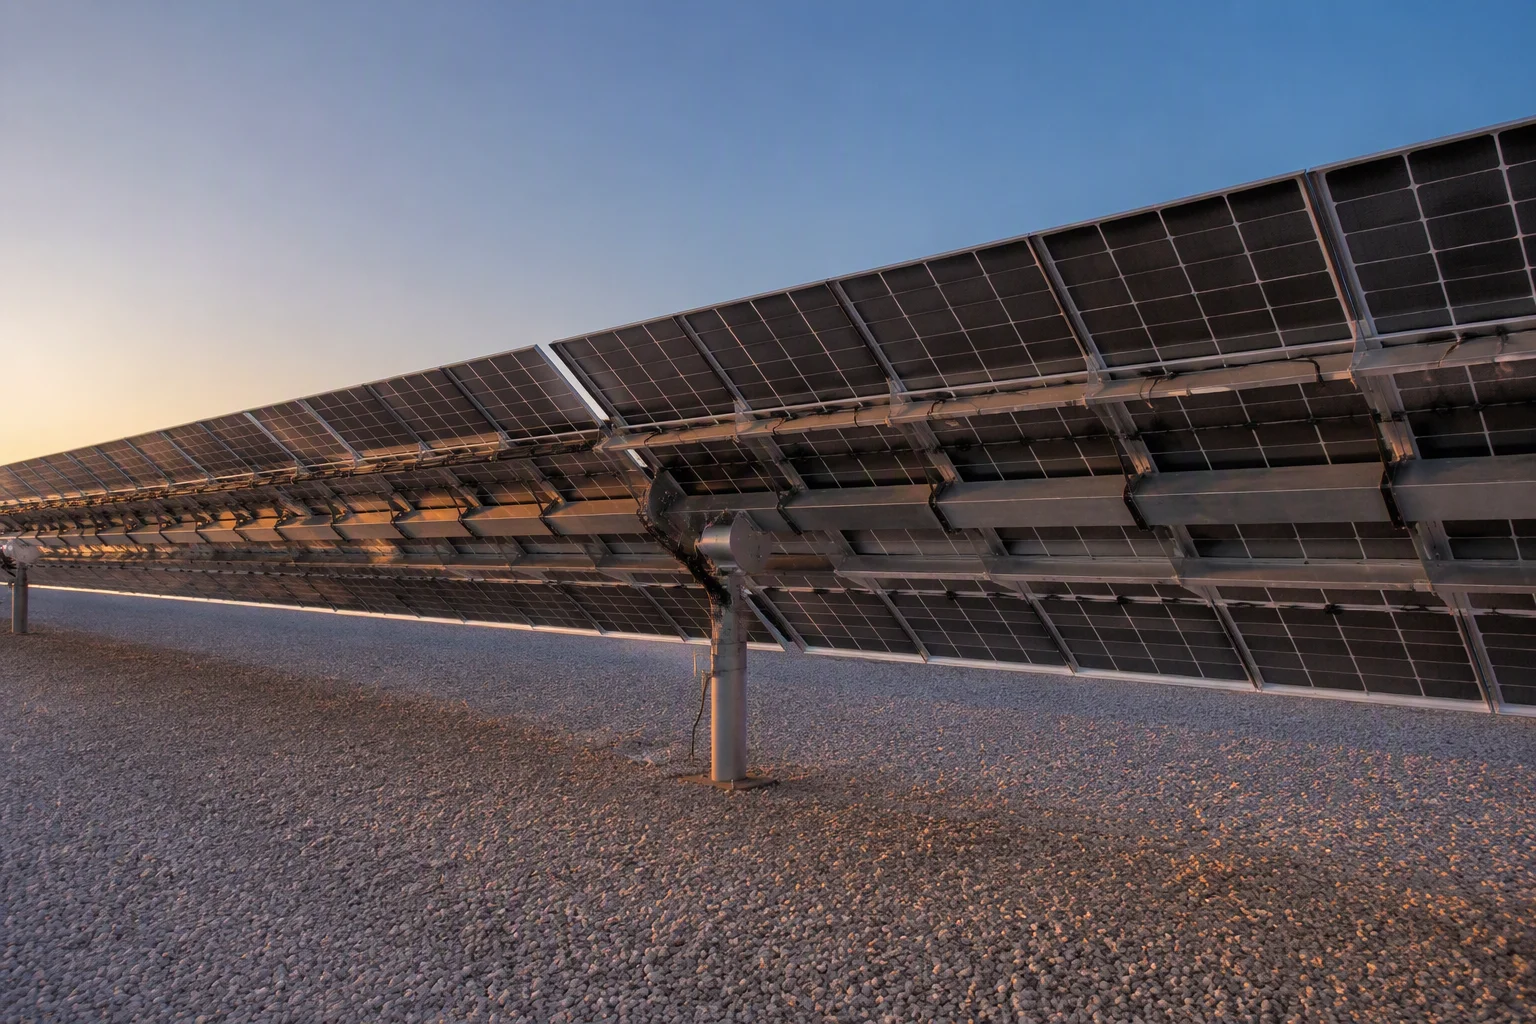
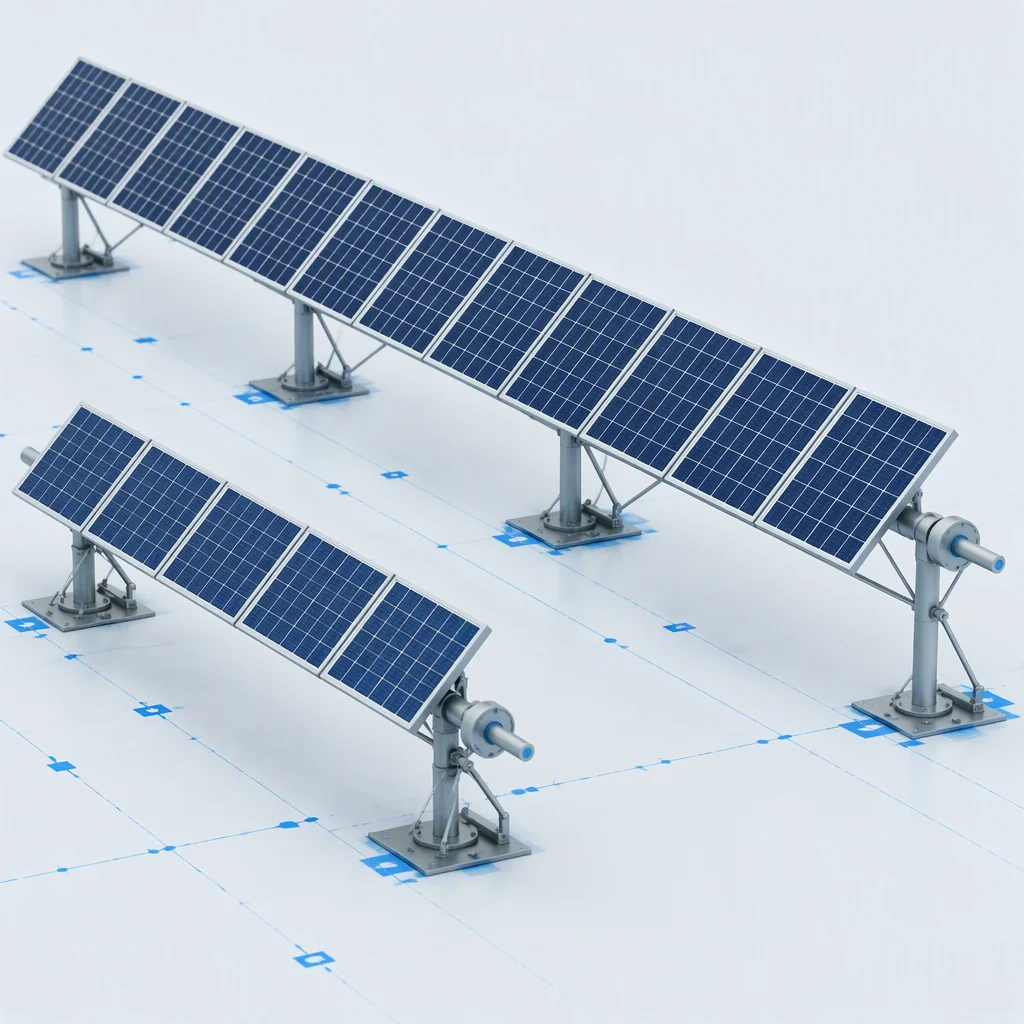
Three levers on the same cost curve
High-power premium
−0.24 to −0.26%/°C temperature coefficient protects yield where midday heat is the enemy.
HJT line →Tracker synergy
Elevated single-axis mounting adds +5–20% bifacial yield at near-zero marginal BOS cost.
Bifacial line →Cost math that wins bids
~25% fewer modules per MW; ~620–680 pcs of 210-format fit per 40'HC — read the full comparison.
Yield guide →
Technical Parameters
EMS-U series — utility TOPCon and HJT bifacial
| Parameter | TOPCon 575–630 W | TOPCon / HJT 700–720 W |
|---|---|---|
| Module type | N-type TOPCon bifacial | N-type TOPCon / HJT bifacial |
| Power range | 575–630 W | 700–720 W (HJT to 730 W) |
| Module efficiency | 22.3–23.5% | 23.0–24.0% |
| Cell efficiency | ≥26.0% | ≥26.0% |
| Bifaciality | ≥80% | ≥85–90% |
| Temperature coefficient | −0.29%/°C | −0.24 to −0.26%/°C |
| Glass | 2.0 + 2.0 mm tempered AR | 2.0 + 2.0 mm tempered AR |
| Dimensions | 2278×1134×30 mm | 2384×1303×33 mm |
| Mechanical load | 5400 Pa snow / 2400 Pa wind | 5400 Pa snow / 2400 Pa wind |
| Warranty | 15-yr product / 30-yr power | 15-yr product / 30-yr power |
| Degradation | 0.4%/yr linear → 87.4% @ yr 30 | 0.4%/yr linear → 87.4% @ yr 30 |
| Bankability certs | IEC 61215/61730, CE, TÜV, PVEL testing, IEC 62941 | Same + UL 61730 for US/Canada |
| Container loading | ~620–680 pcs per 40'HC | ~620–680 pcs per 40'HC |
| Supply assurance | Capacity allocation locked 30 days | Capacity allocation locked 30 days |
Utility FAQ
Answers EPCs ask before shortlisting
Why do 700 W modules cut BOS cost?
A 720 W module replaces roughly four of the old 550 W class per rack on a per-area basis — about 25% fewer modules, trackers and terminations per MW. Fewer parts means less land, steel and wiring, which is exactly where the LCOE race is won.
How much does a tracker really add?
Single-axis trackers with bifacial modules delivered USD 37/MWh LCOE in 2025 — below the fixed-tilt global average. The bifacial rear-side gain runs +5–20% depending on albedo and row geometry, and on a tracker it costs almost nothing extra in BOS.
What makes a module bankable for project finance?
Lenders check certification and warranty first: IEC 61215/61730, TÜV or UL 61730 listing for North America, PVEL-style reliability results, an IEC 62941 quality system and a 30-yr power warranty with 0.4%/yr linear degradation. All ship in our document pack.
Can you guarantee delivery for a large tender?
Yes — we allocate production capacity and lock it for 30 days against your schedule. With 536 GW shipping globally in 2025, allocation is the scarce resource; our export team reserves line time the moment your PO is confirmed.

Utility RFQ
Get a Quote →
Send your MW target — we'll lock the allocation.
MW scale, module class and delivery window. Bankability package included in the quote.
